NYSDEC Mobile Air Monitoring Results
Overview
In 2019, following an escalation in weather events exacerbated by climate change and growing pressure from fenceline and frontline communities (IE, communities directly adjacent to current or former industrial facilities and communities affected first and worst by climate change), NYS passed sweeping and paradigm shifting legislation, the Climate Leadership and Community Protection Act, or the CLCPA.
Part of this bill specifically honed in on the disproportionate environmental and climate impacts that fenceline and frontline communities have borne. Part of these related actions were to identify “Disadvantaged Communities” or DACs in New York, and to direct actions and investments into these areas.
56% of our existing Campaign Areas overlap with DACs in Erie and Niagara County. For comparison, 32% of tracts in DEC Region 9 (Allegany, Cattaraugus, Chautauqua, Erie and Niagara counties) are defined as DAC tracts, as are 35% of census tracts overall in New York State. While largely reflective of areas of WNY that are grappling with environmental injustices, NYS DAC areas do not include some fenceline communities we work with, like the neighborhood of North Tonawanda adjacent to the Fortistar gas plant.
The CLCPA requires Community Air Monitoring programs in DAC areas. Clean Air is participating in this program, and is currently training our first cohort of CAM Leaders who will host PurpleAir monitors at their homes and community centers. Another related program is the DEC’s Mobile Air Monitoring program in which mobile monitoring contractor Aclima, Inc. collected air quality data in 10 disadvantaged communities for one year – the results of this initial study have recently been released to the public, and today we are sharing results in local areas, starting with our campaign areas.
We urge all our members and supporters to take the related survey for the Buffalo-Tonawanda-Niagara Falls areas, which will be open until December 31, 2024, and to review the data yourself, starting with NYS DEC’s StoryMaps, which includes a tutorial for how to use the maps and an in-depth dive into the results for our region, or dive right into the interactive map for our region.
 We also urge our members and supporters to join us on Tuesday October 15 from 5:30-7:30pm at the Buffalo Science Museum, 1020 Humboldt Parkway in Buffalo for NYS DEC’s Community Air Monitoring Public Meeting for our area.
Basic results – Campaign Areas
Tonawandas, River Road area, and Black Rock-Riverside
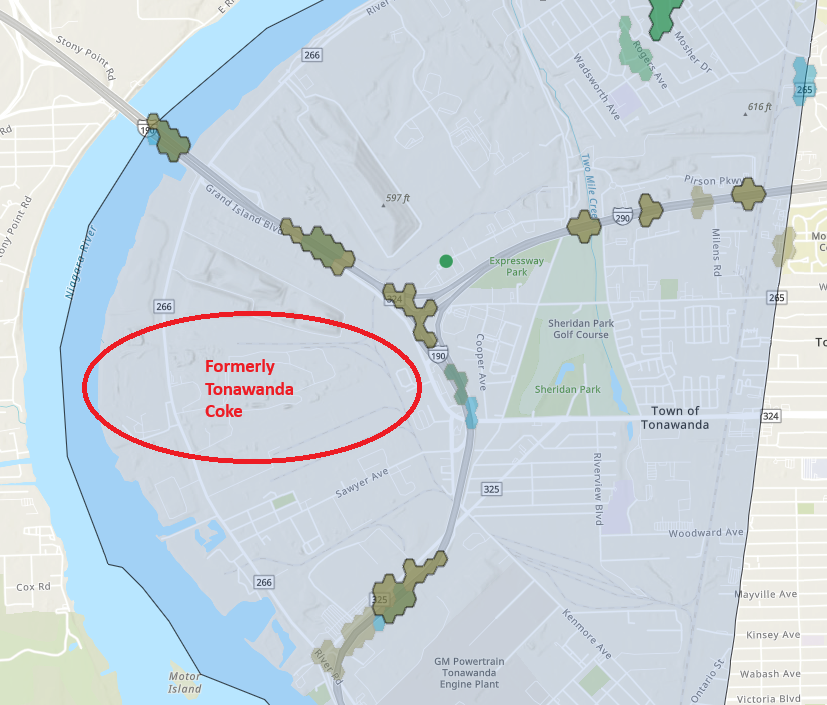 The work Clean Air has spearheaded has led to remarkable successes in our campaign areas in the Tonawandas and Black Rock-Riverside. When we began our work in the 2000s, these areas had some of the worst air pollution in the state, with benzene levels far exceeding public health standards– today is a far different story, largely due to the closure of Tonawanda Coke, NRG Huntley and the removal of the Grand Island toll booths, and the data from this study further emphasizes how important fenceline resident organizing is in achieving better public health and environmental conditions.
This, however, is not to say that the air pollution issues in this area are completely gone – of note, in these areas DEC’s data shows elevated levels of black carbon, PM 2.5, Nitrogen Dioxide, and Carbon Monoxide, largely along major highway corridors, like the 190 and 198. This may be from traffic, but in areas along the 190/Grand Island Boulevard in the Town of Tonawanda, this could also be from area industry – for example, oil terminals are located right next to the 190 approaching the Grand Island bridges, and a pocket of elevated black carbon and carbon monoxide has been detected in that spot. Elevated PM 2.5 in parts of the City of Tonawanda could also be carried from area industrial sources.

 Also of note is a very elevated pocket of methane gas on Kenmore Ave near Military Road, the largest amount detected in any part of our region. This pocket could be from a leak of the gas main located near there, or could be from other nearby sources – for example, NFTA has a large bus service garage at that location, and much of the fleet runs on Compressed Natural Gas (CNG), and DEC’s InfoLocator show several capped and one uncapped well near this spot. The DEC has already begun to investigate to identify the source of this pocket of gas and eliminate the leak source.
Buffalo East Side – Delavan-Grider, Hamlin Park and Filmore-Leroy
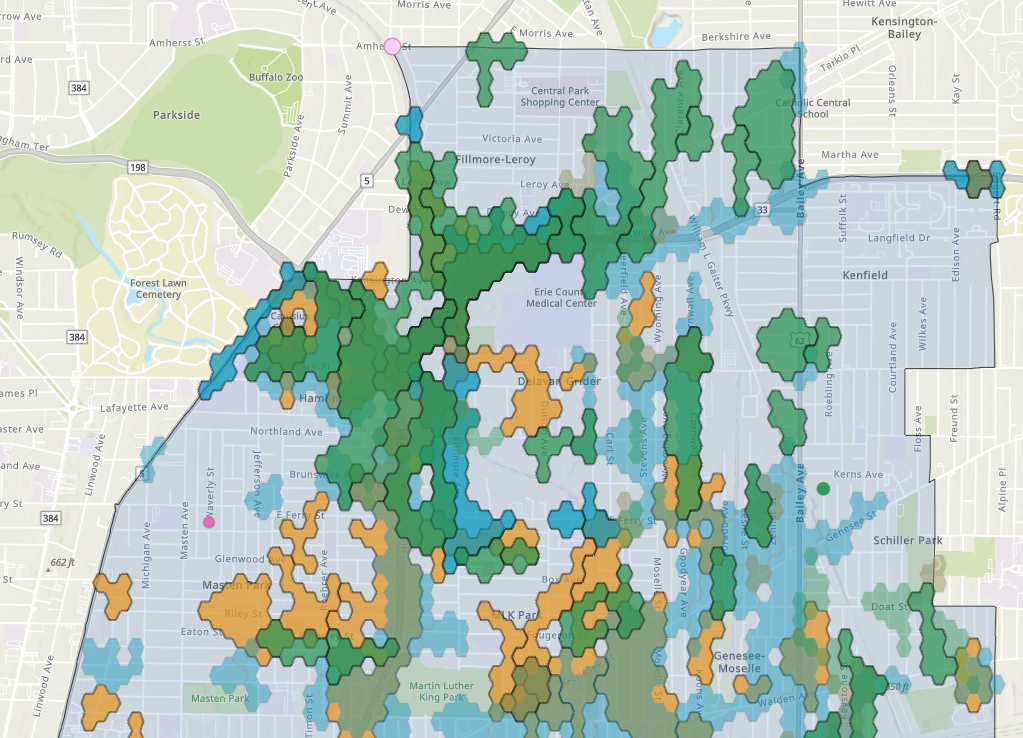 Delavan-Grider and Hamlin Park, and Filmore-Leroy are highlighted in NYS DEC’s StoryMap because of the disparate impacts these neighborhoods are bearing from industrial and automotive traffic pollution. By basically every metric, these neighborhoods are being exposed to emissions levels well above the median of the surveyed areas.
Much of this pollution appears to stem from The 33 and 198 NYS highways. As we have maintained, no matter what the final decision about whether to cap or fully remove the highway, NYS DOT MUST take public health into account and include plans for emissions mitigation – the feeble statements we have heard about how emissions will be reduced as consumers switch to electric cars or how the cap will reduce emissions in areas adjacent to it (while increasing emissions at the cap end points) are unacceptable.
The currently proposed cap plan design maintains at-grade traffic at both ends for several blocks separated from the front porch of residences by only a chain link fence, which is an unacceptable example of blatant environmental racism. Given that there will be further concentrated emissions expected in these areas (NYS DOT’s modeling predicts annual PM 2.5 of 7.5 μg/m3 under the preferred design – while this falls below the EPA’s current recommendations, for comparison, the World Health Organization suggests an annual cap of 5 5μg/m3, well below this “safe” level), and that NYS DOT’s currently preferred design does not include any plans for air quality mitigation such as vegetated sound walls for at-grade areas or stacks with scrubbers to capture emissions in the capped areas, we have to question whether NYS DOT is taking the state’s commitments to environmental justice seriously. We hope this additional data will steer NYS DOT staff to revisit designs to better address these emissions issues.
Buffalo East Side – Seneca Babcock, Lovejoy and Broadway-Fillmore
 While emissions are not as concentrated in the Seneca Babcock and Lovejoy areas as in the Delavan-Grider/Hamlin Park/Filmore-Leroy areas, these neighborhoods are also grappling with disproportionately high emissions compared to other surveyed areas, particularly near Bailey Avenue and the 190. NO2 and Black Carbon in particular are elevated, and there is a concentration of high PM 2.5 near Bailey and Broadway, near our current Lovejoy campaign area. While much of this can again be attributed to automotive emissions, other emissions sources like industrial operations and the railyard are also possible culprits.
Buffalo West Side
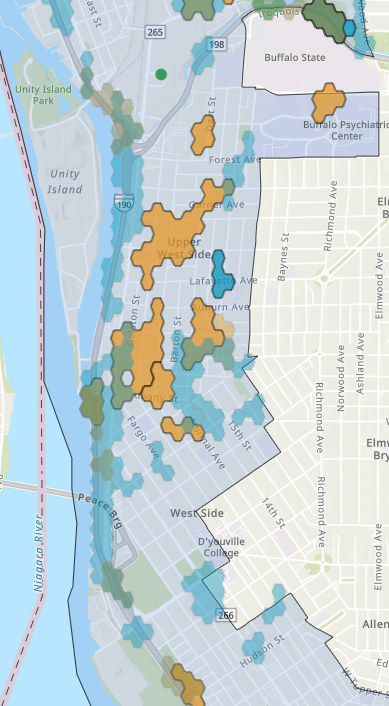 Buffalo’s West Side has elevated levels of NO2 and Black Carbon, mostly along the 190 and near the Peace Bridge. While we successfully fought to prevent an expansion of the Peace Bridge Plaza over a decade ago, it’s clear that more must be done by the Peace Bridge Authority and NYS DOT to address air quality issues on Buffalo’s West Side from automotive traffic. There are other possible sources of these elevated emissions, including industrial sources – further analysis is needed.
Basic Results – other hot spots of note
Niagara Falls
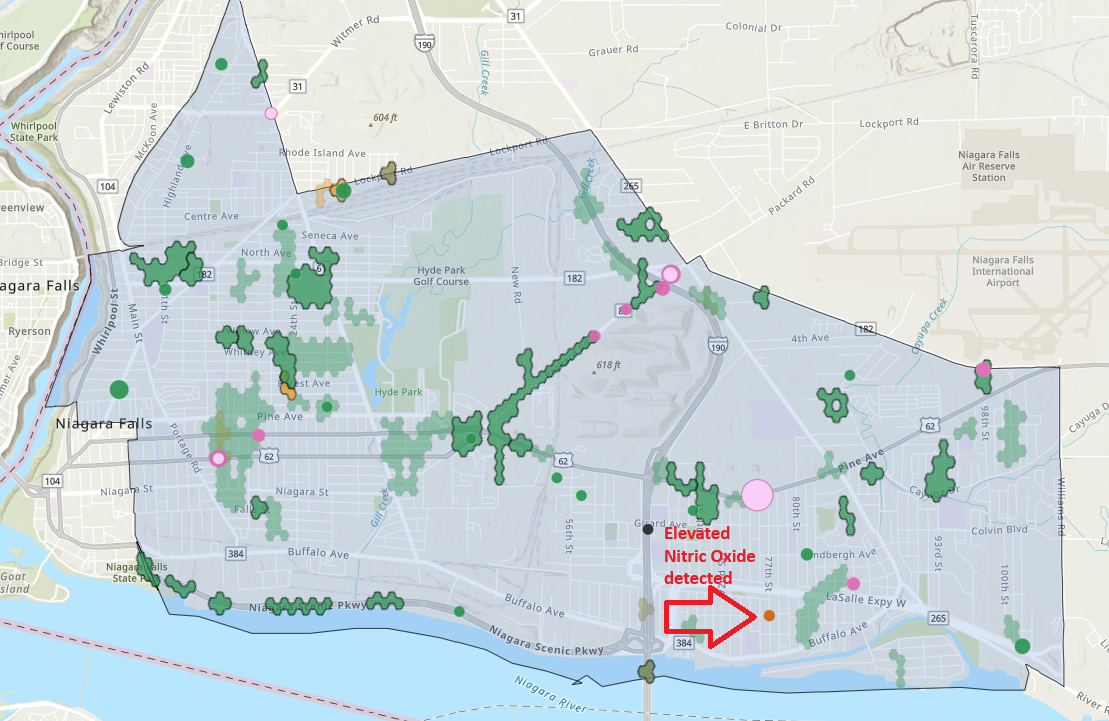 Niagara Falls has several areas of elevated emissions, particularly PM 2.5. Perhaps more alarming are the pockets of detected Hazardous Air Pollutants (HAPS) and other unique pollutants, like peak detections of Nitric Oxide just north of the LaSalle Junior High School. NYS DEC calls out the Packard Road and NYS Route 62 areas in particular in their StoryMap. If you turn on the “Sensitive Receptors” layer, you can also see how close these pollution pockets are to locations like early childhood centers, the Niagara Falls High School, and affordable housing developments.
Over the past several years, we have been increasingly noting the ongoing air quality issues and environmental injustices in Niagara Falls – while again automotive traffic is responsible for a large amount of these emissions, poorly controlled emissions from industry in Niagara Falls is also clearly responsible for at least a portion. Clean Air is member-led and we concentrate our campaign work within our member areas. If you are a Niagara Falls resident and are interested in building a cohort of members as we grow as an organization, please reach out to Chris.
If you have any questions about the results of the Mobile Air Monitoring project, we urge you to send those questions to CLCPA.CAM@dec.ny.gov, and please consider cc’ing us at info@cacwny.org.
Please also join us on Tuesday October 15 from 5:30-7:30pm at the Buffalo Science Museum, 1020 Humboldt Parkway in Buffalo for NYS DEC’s Community Air Monitoring Public Meeting for our area and remember to fill out and share the related survey before the end of the year.
Learn More
Main DEC CAM Webpage – https://dec.ny.gov/environmental-protection/air-quality/community-air-quality/2022-23-statewide-community-air-monitoring-initiative
Buffalo Story map – https://storymaps.arcgis.com/collections/b39806cbc7ea4b139b79713720dab25f?item=4
Buffalo interactive map – https://experience.arcgis.com/experience/08b1dcca4fa24f26a77d31ac9cd1ff91/page/Buffalo/?views=Fact-Sheets
NYS DEC Press Release – https://dec.ny.gov/news/press-releases/2024/8/dec-releases-first-phase-results-of-statewide-community-air-monitoring-initiative
Buffalo News – New map Shows where air pollution is bad in Buffalo
Buffalo News Editorial Board – DEC data shows action needed on air pollution
RSS 2.0 feed. Both comments and pings are currently closed.